
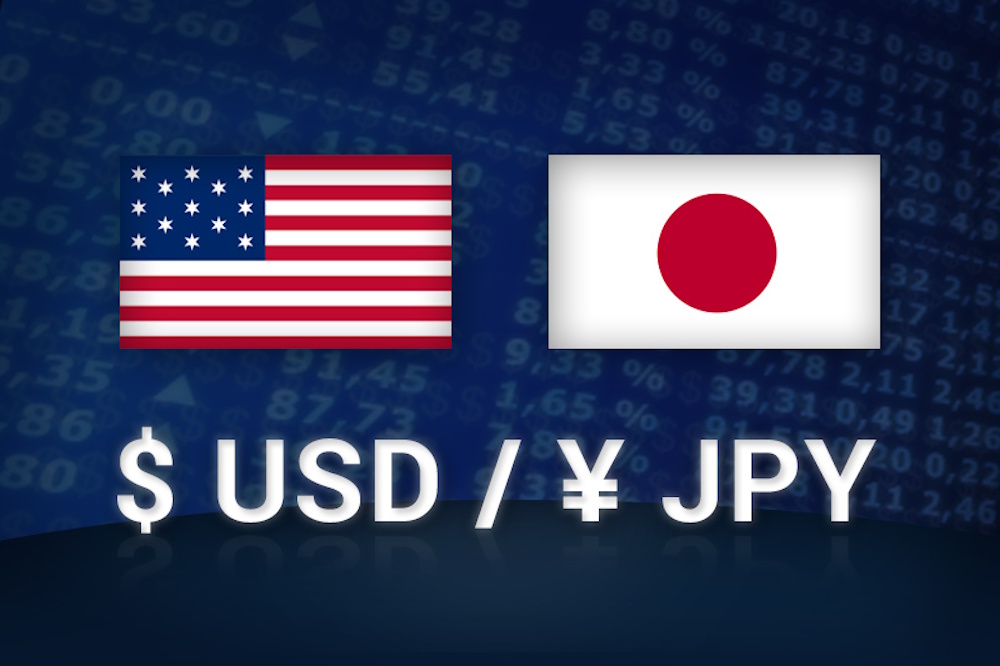
The USD/JPY structure has resumed a definitive upward trajectory following the correction from the 161.94 peak, which retraced to 139.87 and subsequently paused. The three-wave decline to 139.87 appears to be complete, and the pair has now moved back above 157.88, further extending the recovery phase that began from the 142.66–145.47 area. The ongoing movement is progressing towards a Fibonacci projection at 158.80, identified as the 161.8% extension of the rally from 142.66 to 150.90, measured from 145.47. Provided that the price remains above the near-term support band near 156.10, the market is viewing this as a continuation of the trend rather than an indication of a peak. A sustained break of 158.80 paves the path to the 200% projection around 161.95, effectively serving as a retest of the 161.94 peak. The price action conveys a clear indication: the decline from 161.94 to 139.87 appears to be concluding, and the broader upward trend originating from 102.58 is attempting to reestablish itself within the 158–162 range. On the higher timeframes, USD/JPY continues to experience a long-term upward trend that initiated at 75.56 in 2011 and was further supported by the 102.58 low in 2020. The increase from 102.58 to 161.94 established a significant primary upward movement. The recent decline to 139.87 can be viewed as a corrective phase within the larger framework, rather than indicating a complete trend reversal. Should the market break through the range of 158.85–161.94 with conviction, the technical indicators suggest that the subsequent significant target area lies around 176.55. This level is derived from the 61.8% extension of the movement from 102.58 to 161.94, measured starting at 139.87. This level represents a medium-term concept rather than an immediate target. It clarifies the aggressive behavior of dip-buyers above 140 and illustrates why every pullback toward the mid-150s is perceived as an opportunity rather than a threat. From a structural perspective, the bullish thesis begins to weaken if USD/JPY falls back below the 154.38–154.30 area, transforming the recent range into a phase of broader consolidation rather than a launching point.
The most recent U.S. jobs report bolstered the dollar aspect of USD/JPY. Non-farm payrolls for December came in at approximately 50,000, falling short of the 66,000 consensus. However, this figure does not indicate significant labor market distress or necessitate prompt rate reductions. The market interpreted this as “slower but still functional” employment, rather than an indication of a recessionary decline. Rate expectations have been modified accordingly. The likelihood of the Federal Reserve maintaining rates at the January 28 meeting has risen to over 95%, while the chances of no change in March are approximately 70.9%. In April, there remains a prevailing inclination toward a neutral position instead of swift easing. The recent repricing has resulted in an increase in the dollar’s value against the yen, contributing to a four-session winning streak in USD/JPY and a short-term gain exceeding 1%, with the spot price now above 157. The DXY index has ascended past 99 and is testing the significant 100 level, indicating that capital is shifting back toward U.S. assets instead of moving away from them. For USD/JPY, this scenario—labor that is cooling but not collapsing and a central bank content with maintaining its current stance—ensures that the interest-rate spread remains strongly in favor of the dollar. The current landscape of U.S. macroeconomic data supports the notion of prolonged elevated conditions. A previous 6.4% monthly increase in building permits, following a −3.7% figure, suggested that the housing slowdown was stabilizing rather than deteriorating. Recent activity data extending into late 2025 has indicated that the economy possesses greater momentum than pessimistic forecasts suggested, with growth revised upward to approximately 4.3% annualized in Q3, compared to prior expectations of around 3.3%. This type of upward adjustment complicates the Fed’s ability to swiftly transition into a rate-cutting phase.
Markets have transitioned from aggressively anticipating multiple early cuts to now pushing the first significant easing risk into mid-year. This shift is contingent upon inflation and job metrics deteriorating more than they currently have. This adjustment is evident in DXY trading: the index rebounded from the mid-90s, formed a double-bottom-type structure, and is currently maintaining the 99 neckline. A sustained hold above that zone would pave the way to 100.40, followed by 102–104.60. Each incremental increase in the dollar index systematically bolsters USD/JPY, particularly as the yen continues to be constrained by a significantly weaker domestic rate environment. The narrative surrounding USD/JPY remains heavily influenced by a central bank that has yet to completely transition from its ultra-easy policy stance. The Bank of Japan has hinted at normalization but remains in a data-dependent stance, oscillating between slightly hawkish indications and neutral phrasing. Markets are aware that any tightening will proceed at a gradual pace, remain constrained, and depend on specific conditions, while the Fed, even at its highest point, continues to provide a real policy rate that significantly exceeds that of Japan. The ongoing yield gap remains a magnet for carry trades in USD/JPY, particularly in a risk-on global environment where the appetite for the safe-haven yen is diminished. The pricing pattern indicates that whenever the spot approaches the mid-150s, buyers tend to enter the market, providing support around the 155–154.80 range and again near 154.30. Given the constraints on Japanese government bond yields and the significantly lower domestic inflation expectations compared to the U.S., the yen continues to face structural disadvantages. That is why the pair can trade near one-year highs even when U.S. data is simply “okay” rather than exceptional.
The short- and medium-term technical indicators for USD/JPY are consistent with this macro perspective. On a multi-day chart, the price is experiencing a strong upward trend that initiated around 139.80 in April 2025, marked by a series of higher highs from May to November, with a support band established in the 155–154.80 range. On the weekly chart, the breakout last week above 157.88 has continued the upward movement from 139.87, maintaining attention on the 158.80 target, representing the 161.8% extension of the 142.66 to 150.90 range. Above 158.80, the next significant level is at 161.95, which coincides with a 200% projection and the previous peak of 161.94 that limited the 2024 advance. Oscillators indicate a bullish outlook, yet they also caution that the market is becoming overheated. The RSI is gradually rising above the 50 line and approaching overbought territory near 70, indicating ongoing buying momentum while also highlighting the potential for significant corrective movements as positions become fully established. The MACD histogram is widening above zero, indicating that trend momentum remains positive. The critical threshold on the downside is approximately 156.00–156.10, where short-term moving averages align with trend support. A pullback that remains above that level is merely a correction within an upward trend. A decline below 156.00 reveals 155.78, followed by the wider range of 155–154.80 cradle. A daily close above approximately 154.30–154.38 is necessary to maintain the bullish structure; otherwise, it could lead to levels around 153, 151.80, and potentially a deeper decline towards the 150 mark. Until that occurs, the market is favoring traders who capitalize on weakness rather than those who bet against strength.
The dynamics surrounding USD/JPY are being bolstered by the behavior observed across various asset classes. Japanese equities exhibit robust performance: the Nikkei 225 has reached new record highs following a 2025 performance of approximately 25%, signifying a third consecutive year of gains exceeding 20%. Since the low in 2008, the index has surged over 13,000%. While momentum indicators suggest some signs of fatigue and notable companies such as SoftBank and Sony are experiencing instability, the overarching trend remains positive. The yen faces challenges in drawing haven flows as domestic equities reach all-time highs and major financial institutions like MUFG demonstrate robust upward trends. Simultaneously, gold has surpassed $4,500, reflecting an approximate 4% weekly increase despite the strengthening dollar. This unusual scenario indicates a heightened global demand for hedging against geopolitical risks and policy uncertainties, rather than a sign of dollar weakness. This indicates that investors are not shifting away from dollars to seek protection; rather, they are acquiring both the dollar and hedges, aligning with the resilience observed in USD/JPY. In the realm of digital assets, Bitcoin is hovering near $90,000, yet remains beneath its 50-day EMA. Meanwhile, Ethereum is positioned slightly above $3,000, with ETF products associated with it experiencing over $500 million in outflows since late 2025. Capital is not forsaking the dollar to pursue crypto; it is returning to U.S. yields and distancing itself from non-yielding risk. The flow mix bolsters the dollar component of USD/JPY, resulting in minimal organic support for the yen, aside from sporadic risk-off spikes.