
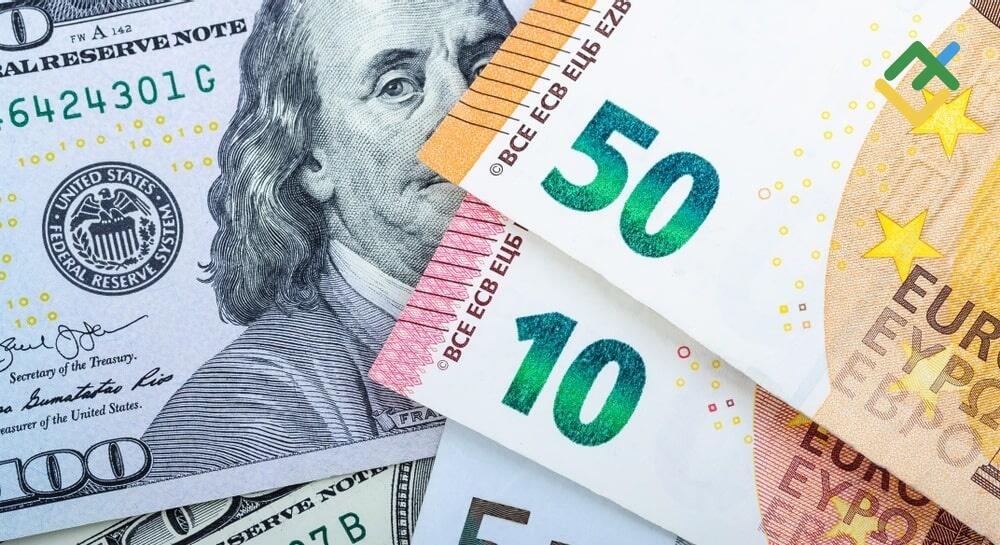
EUR/USD is currently at 1.1604 in mid-session Friday trade, May 22, 2026, reflecting a decline of approximately 0.15% for the day and poised to finish the week lower for the fourth consecutive session. The pair has been subtly declining beneath a descending trendline established from the early-May rejection at 1.1795, with intraday movements navigating through the 1.1600 level during European hours before stabilising just below it. The week’s range features a high close to the 1.1666 retest of the declining moving average cluster and a low at 1.1594, establishing a narrow band that conceals a significantly more critical structural landscape. Positioning this consolidation within the context of the broader macroeconomic landscape yields a clear interpretation. The euro faces dual pressures as stagflation risks in the eurozone compel the rates market to adjust its ECB hike expectations from a peak of 85 basis points for the year to approximately 65 basis points currently. Meanwhile, the Dollar Index stands at 99.28, navigating an upward two-week channel and maintaining its post-CPI momentum. The market assigns a 2.6% probability to a Federal Reserve rate cut at the June meeting, while 97.4% anticipate that the 3.50% to 3.75% range will remain intact. Additionally, the forward strip now reflects the potential for rate hikes as early as 2027. The pair is currently outside of a defined range. It is situated within a controlled distribution characterised by lower highs and lower lows, requiring merely a definitive closing breach of the 1.1570 to 1.1500 support range to validate a projected move towards the 1.1350 to 1.1115 area, as indicated by the prevailing wave-count analyses currently in circulation. The price action on the lower timeframes is generating a structure that necessitates no particular interpretation.
The EUR/USD pair is exhibiting a pattern of lower highs and lower lows on both the 2-hour and 4-hour charts. Rejection candles are consistently forming against the descending trendline, which has effectively limited every rally attempt since the early-May peak at 1.1795. The pair encountered resistance at the red moving average around 1.1660, evidenced by bearish wicks indicating a rejection at distribution. The RSI is positioned below 48, indicating a distinct lack of bullish momentum, while the MACD remains entrenched in negative territory following a short period of flatlining earlier in the week. The volume profile serves as a more diagnostic tool compared to the indicators themselves: the 1.1620 zone is identified as resistance, with sellers evidently dominating the order book, while the range of 1.1580 to 1.1560 represents the subsequent layer of demand. A daily close beneath 1.1570 establishes 1.1500 as the initial measured target. A clean break of 1.1500 then exposes 1.1470, and a confirmed loss of that floor mechanically transitions the chart from corrective consolidation into trending breakdown, with 1.1350 as the next significant demand cluster and 1.1115 as the deeper structural objective. On the upside, the resistance lattice initiates at the descending trendline near 1.1660, followed by 1.1700 above that, with the cycle pivot at 1.1795 serving as the line that delineates the entire trade. Nothing above the chart becomes constructive until a daily close above 1.1795 is achieved, accompanied by confirming volume. Until then, every rally is being sold rather than pursued, and the rejection candles illustrate that narrative without the necessity of consulting any indicators.
The medium-term wave count firmly establishes the bearish interpretation with accuracy. On the weekly timeframe, an ascending wave of larger degree B is developing, with wave (A) of B forming as its component. Meanwhile, on the daily timeframe, the third wave 3 of (A) is unfolding, with wave i complete and a corrective wave ii now developing. On the 4-hour chart, wave (c) of ii is taking shape, with wave iii of (c) currently underway — representing the most assertive segment of any corrective sequence and the phase that has traditionally produced the clearest impulsive movements. If that count is accurate, EUR/USD is poised to decline toward the 1.1350 to 1.1115 range before the overarching uptrend re-establishes itself. The level that invalidates the entire bearish framework is 1.1795. A breakout and consolidation above it would reopen the path to 1.2088 to 1.2400, but the structural map is clear regarding the prerequisite: nothing in the chart turns bullish until that pivot is reclaimed. Until then, each corrective bounce presents a selling opportunity rather than a foundation for the subsequent upward movement. The shorter-term setup is optimally characterised by a stop positioned above 1.1835 for short positions initiated on rallies beneath 1.1795, with profit-taking targets established at 1.1350 initially and extending to 1.1115 for a more substantial move. The long alternative necessitates a prolonged breach above the range of 1.1755 to 1.1795, with protective stops positioned beneath the breakout level. Initial targets are set at 1.2088, with an extension towards 1.2400. The trade structure is binary at the 1.1795 pivot, and the price action this week indicates the market’s chosen side of that pivot.
The dollar side of the cross is performing the majority of the significant work in this movement, and the DXY at 99.28 serves as the pivotal data point that connects all elements involved. The dollar index is currently positioned within a blue ascending channel that has developed since the lows observed in mid-May, characterised by the emergence of green continuation candles as it approaches the red 50 moving average around 98.90. The index is currently producing higher highs and higher lows, with bullish engulfing patterns emerging near the 99.00 support level. The RSI is above 55, suggesting a constructive momentum while not yet indicating overbought conditions. The Fibonacci extension targets above the spot price are positioned at 99.41, 99.51, and 99.73, while the volume profile validates 98.97 as a robust support level, indicating that buyers are prevailing in the order book at that point. That is the standard framework of a trending breakout, and as long as it persists, the cross-rate pressure on EUR/USD will continue to be unfavourable. The dollar has experienced a sustained bid due to three interrelated factors: an above-consensus April CPI print that surprised the market with persistent inflation in both headline and core readings, particularly in shelter; a hawkish stance from Fed Governor Christopher Waller, who indicated the central bank should “hold rates steady for the near term” and cautioned that the next move could be a hike if inflation continues to exceed expectations; and the swearing-in of Kevin Warsh as the new F
The euro side of the pair is experiencing pressure due to a declining fundamental backdrop, which is further exacerbated by the strength of the dollar. Germany’s first-quarter GDP registered a growth of +0.3% quarter-on-quarter, a figure that suggests resilience when viewed in isolation, yet it masks a precarious outlook. The economy remains heavily dependent on imported energy, and the sustained run in Brent crude at $104.12 with WTI at $97.72 is feeding directly into Europe’s inflation and growth profile in a way that is meaningfully more painful than the equivalent macro stress on the U.S. side. The fiscal optimism that had been accumulating earlier in the year regarding defence and infrastructure expenditures in Berlin has begun to diminish, with the latest survey data bolstering the narrative of a slowdown. This week’s PMI surveys indicated a distinct decline in business activity throughout the eurozone, as the composite reading fell into a range that undermines the recovery narrative that proponents were attempting to build in March. The combination of slowing growth and ongoing imported inflation is exactly the scenario that undermines the euro’s reliance on rate differentials for support. Markets had anticipated 85 basis points of cumulative ECB tightening earlier this year, based on the premise that the central bank would need to counteract the inflation pass-through resulting from oil. That pricing has been adjusted to approximately 65 basis points as the tradeoff between growth and inflation has shifted towards concerns about growth. Consequently, the two-year real yield differential between the U.S. and the eurozone has moved in favour of the dollar, which serves as the mechanical driver of the EUR/USD downtrend.