
EUR/USD is currently positioned at $1.1584 on Monday, March 23, 2026 — a figure that may seem stable at first glance, yet beneath this surface tranquility lies one of the most intricate technical and fundamental configurations the world’s most liquid currency pair has exhibited in years. The pair commenced the session with a downward gap, reaching a low of $1.1412 earlier this month on March 13. It has been experiencing a medium-term downtrend, declining from a 2026 high of $1.2079 to its current levels — a range that reflects the significant impact of the Iran war on global currency markets. The U.S. Dollar Index maintained a position above 99.75 until Trump’s announcement regarding constructive discussions with Iran caused a decline, retracting to around 98.83 as market risk appetite increased. However, the underlying factors that contributed to the dollar’s safe-haven premium in recent weeks remain unaddressed despite a brief diplomatic opportunity. The current dynamics in EUR/USD are far from a straightforward risk-on/risk-off narrative. Instead, we are witnessing a convergence of factors: the dollar’s role as a petrocurrency, the ECB’s surprising shift towards a hawkish stance, the Fed’s stagnant rate trajectory, the unwinding of popular trades, and the technical indication that the pair might be establishing a near-term floor, despite the overarching bearish trend in the longer term.
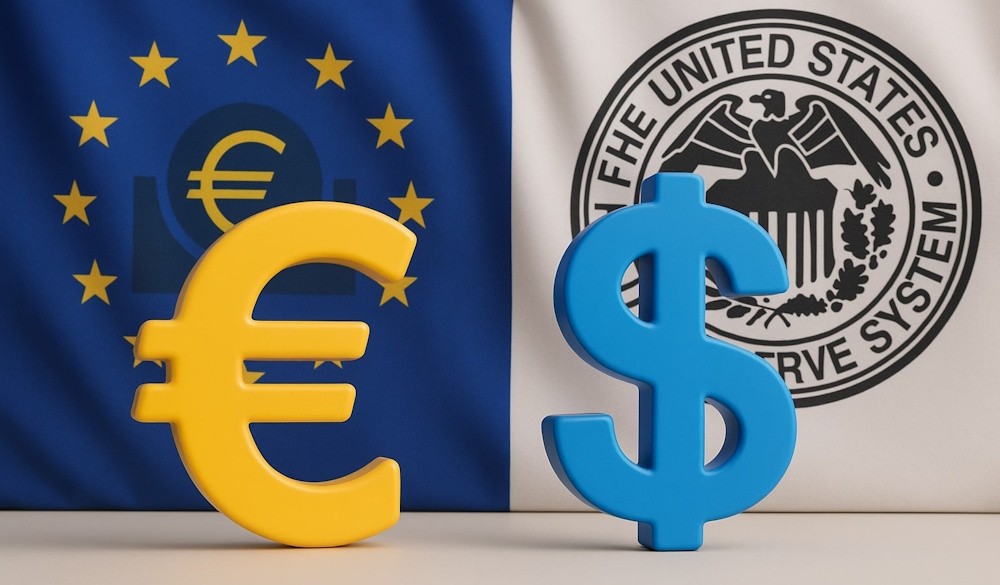
The primary fundamental factor influencing EUR/USD is the interest rate differential between the European Central Bank and the Federal Reserve. Currently, this differential stands at 160 basis points in favor of the dollar, with the Fed funds rate at 3.75% and the ECB deposit rate at 2.15%. The gap has served as the main structural burden on the euro for a significant portion of the past year, clarifying the reason behind EUR/USD’s medium-term downtrend over the last several months, even in light of the euro’s previous rise to $1.2079. A 160 basis point yield differential favoring the dollar presents a significant challenge for the euro. Institutional capital tends to gravitate towards the higher-yielding currency when there are no opposing influences, and this trend has consistently contributed to selling pressure on the euro. The ECB’s posture underwent a significant transformation last week. The central bank maintained rates at 2.15% during its latest meeting, yet provided clear cautions regarding the inflationary effects stemming from the energy shock caused by the Iran conflict — wording that sparked immediate market speculation regarding potential multiple rate increases by the ECB in the near future. Prior to the ECB meeting, market expectations indicated that any rate hikes from the ECB would not occur until at least June. Following the meeting, ING observed that ECB officials are contemplating a potential hike as soon as April should inflation exceed the target significantly — a declaration that fundamentally alters the course of the rate differential. Should the ECB implement two rate increases while the Fed maintains its rate at 3.75%, the 160 basis point differential will decrease, resulting in an upward adjustment of the structural floor for EUR/USD. The euro surged following the ECB’s hawkish stance, only to relinquish its gains as pressures in the energy market resurfaced — a scenario that vividly illustrates the ongoing struggle between rate expectations and energy market influences.
The inflation data presently recorded in the decision frameworks of the ECB and Fed is already outdated, and both central banks are aware of this fact. EU inflation is recorded at 1.9%, which is below the ECB’s target of 2.0%. In contrast, U.S. inflation stands at 2.4%, exceeding the target but not by a significant margin. The figures presented here represent the situation prior to the commencement of the Iran war on February 28. The Strait of Hormuz has been effectively closed since that date, and the subsequent energy price shock — with Brent crude trading as high as $114 a barrel before Monday’s partial pullback — will impact consumer prices with a delay of about 4-6 weeks. By April and May, the inflation landscape in both economies is expected to undergo significant changes. Currently, inflation derivatives in the United States are indicating that headline CPI is projected at around 3.4% for March, increasing to 3.8% for April, and nearing 3.9% for May — figures reminiscent of those observed in 2023. The eurozone is confronted with a comparable or possibly more severe inflation path due to Europe’s inherent reliance on energy imports. European natural gas prices, as indicated by the Dutch TTF front-month contract, experienced a remarkable increase of over 90% this month prior to Monday’s partial correction. This surge was primarily influenced by the closure of Hormuz shipping lanes and considerable damage to Qatar’s LNG export infrastructure due to Iranian strikes. The 90% monthly increase in European natural gas prices represents an unprecedented input cost shock for European industry, households, and ultimately consumer prices. As the EU inflation figures for April are expected to come in around 3.5-4.0%, assuming energy prices stay high, the ECB’s approach will pivot significantly. The focus will transition from addressing below-target inflation to combating a price increase driven by energy costs, which poses a risk of becoming ingrained in wage expectations. The situation at hand lends credibility to the ECB’s hawkish pivot, presenting EUR/USD with its sole authentic near-term upside catalyst.
The most important analytical development in EUR/USD over the past five weeks has been the change in the dollar’s market identity. Throughout the majority of the post-2008 financial landscape, the dollar’s position as a safe haven was largely driven by the depth of the Treasury market and the demand arising from geopolitical crises — during times of global uncertainty, investors flocked to the dollar, irrespective of fluctuations in oil prices. The conflict in Iran has fundamentally altered that relationship as events unfold. The correlation between the DXY and Brent crude futures has significantly intensified since the onset of the war, with the dollar increasingly behaving as a petrocurrency — appreciating alongside rising oil prices, contrary to its usual role as a geopolitical safe haven. The analysis is clear yet significant: the United States has emerged as the leading oil producer and exporter globally, and a prolonged period of elevated oil prices positively impacts the U.S. current account balance, boosts corporate earnings within the energy sector, and influences inflation expectations that maintain a hawkish stance from the Fed. In contrast, Europe relies on imports for about 60% of its energy needs. This dependency implies that any increase in the Brent price translates directly into a wealth transfer from the eurozone to oil-producing countries. Consequently, this situation exacerbates Europe’s current account deficit and exerts downward pressure on the euro. MUFG explicitly noted this dynamic, highlighting that the DXY correlation with yield spreads has weakened significantly, with Brent crude now taking precedence. Consequently, EUR/USD is exposed to ongoing downside risks as long as the conflict continues and oil prices remain high. This represents a fundamental change in the trading dynamics of EUR/USD, rather than a fleeting anomaly. Despite the ECB adopting a more aggressive stance, the dynamics within the energy market will constrain the extent to which this shift can effectively bolster the euro until oil prices stabilize. Credit Agricole has upheld its prediction for EUR/USD to decrease toward $1.10 this year, aligning with the perspective that energy dynamics will take precedence over rate differential changes in the short term.
The EUR/USD pair has fluctuated within a 52-week range of $1.0471 to $1.2079, positioning the current level of $1.1584 approximately at the midpoint of that range. However, the context is of great significance. The pair reached $1.2079 earlier in 2026, subsequently experiencing a significant decline as the Iran war broke out in late February. The swing low of $1.1411 on March 13 stands as a critical technical level within the pair’s current framework — marking a seven-month low, serving as the foundation for the ongoing corrective bounce, and representing the threshold whose breach would signal a confirmed return to the overarching bearish trend established following the $1.22 rejection. Every analyst observing this pair has $1.1411 highlighted on their charts. The key resistance cluster above the current price presents a more intricate scenario. The 9-day EMA is positioned around $1.1554, offering immediate support. The initial significant resistance is positioned at the upper limit of the descending channel near $1.1570, a level that the pair has been approaching without strong determination. Above that, the 50-day EMA at around $1.1676 serves as a more critical obstacle — surpassing the 50-day EMA in the present context would necessitate a considerable change in the macroeconomic landscape. The key overhead reference is the convergence of moving averages and horizontal resistance at $1.1683, which analysts at Forex.com have noted as a “challenging test in the current environment.” For the bulls to substantiate a credible argument for a trend reversal, it is essential to reclaim the previous uptrend support level established in early August 2025 — a daily close above $1.1615 would serve as the initial confirmation signal. The deceptive close above that level last Thursday, which reversed during Friday’s session, exemplifies the type of bear trap that deters early long positioning.
The technical indicators for EUR/USD are conveying a complex signal that is being misunderstood by both bullish and bearish participants. The 14-day RSI at 44 is positioned below the 50 midline, indicating a technical signal of ongoing selling pressure and a lack of bullish momentum. However, it is important to note that RSI is establishing higher lows while the price action stays compressed, indicating a classic bullish divergence signal that often precedes significant recoveries. The MACD has crossed the signal line from below and is starting to rise — while not an aggressively bullish signal, it clearly indicates that downside momentum is waning. The SMA50 and SMA200 are situated above the current market price, indicating that the overarching bearish trend continues to hold firm. The accurate technical interpretation is not “bullish” — it’s “less bearish.” Directional risks have shown a notable improvement in balance compared to the lows observed on March 13 at $1.1411. The 1.1550 level stands out as a crucial near-term pivot. Every technical analyst monitoring this pair recognizes it as a “untrustworthy” level for protection, yet it has consistently drawn two-way flows and should not be overlooked due to the regularity of price reversals in its vicinity. The 2-hour chart indicates that the pair is currently confined between the 50-period moving average, which is stable around $1.1532, and the descending trendline originating from the $1.1673 peak. This compression is poised to lead to a directional move, with the forthcoming developments from the Iran talks likely influencing the direction of that move.